Imagine you’re standing in front of a giant roller coaster. You look at the twists and turns and try to figure out if the next drop is going to be scary or thrilling. In the world of investing, technical analysis is like studying that roller coaster to predict its next move. It’s all about looking at past price movements and trading volumes to guess where the prices of stocks, currencies, or other assets might go next.
What is Technical Analysis?
Technical analysis is a way to evaluate and predict the price movements of financial assets like stocks or currencies. Instead of looking at the company’s profits or news about the economy, technical analysis focuses on charts and patterns. Think of it like a detective solving a mystery by looking at clues in the form of price charts and trading volumes.
The Basics of Charts:
When you start with technical analysis, the first thing you need to understand is charts. A chart is like a map showing the journey of a stock’s price over time. There are different types of charts, but the most common ones are line charts, bar charts, and candlestick charts.
A line chart is the simplest one. It shows the closing prices of a stock over a period, connected by a line. It’s like drawing a line through the highs and lows of the roller coaster.
A bar chart is a bit more detailed. It shows the opening and closing prices, as well as the highest and lowest prices during a period. It’s like seeing not just the roller coaster’s main track but also all the loops and dips.
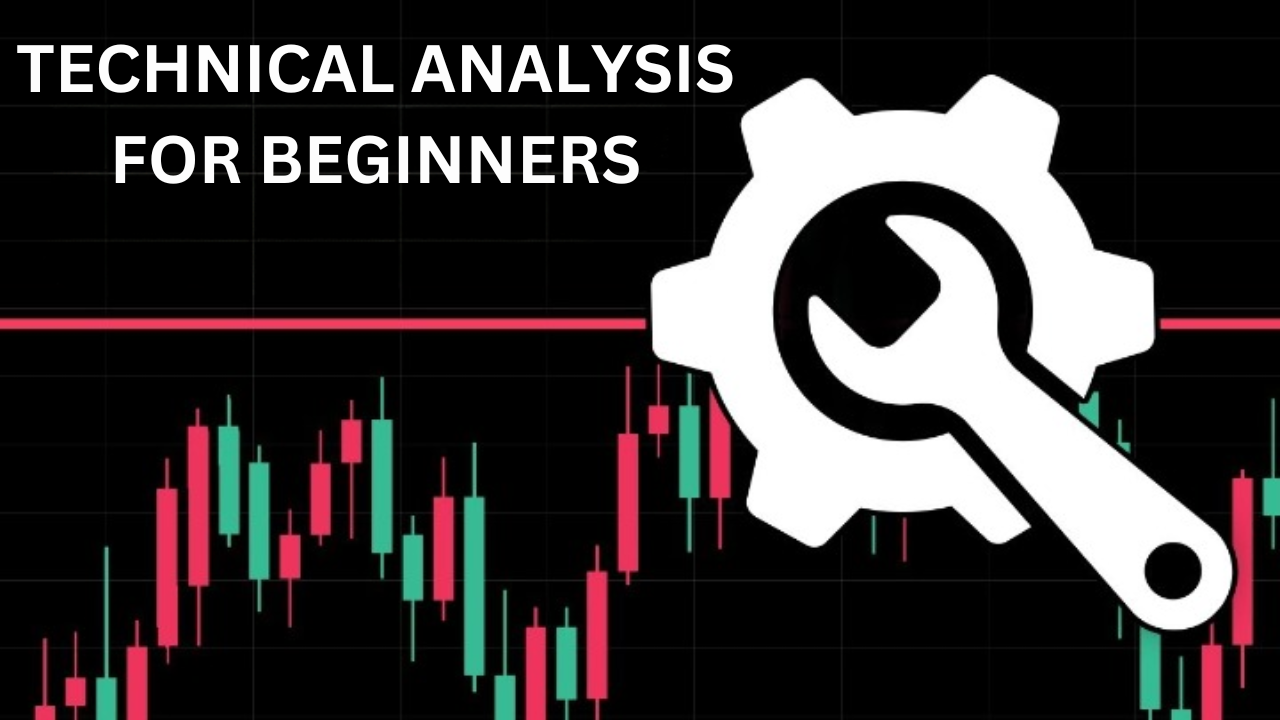
A candlestick chart is the most popular. It looks like a series of candles with wicks. Each “candle” represents a period, showing the opening, closing, highest, and lowest prices. The color of the candle tells you if the price went up or down. Green (or white) candles mean the price went up, while red (or black) candles mean it went down.
Trends and Patterns:
Once you have your chart, the next step is to spot trends and patterns. A trend is the general direction in which the price is moving. Just like a roller coaster can be going uphill, downhill, or flat, a stock can be in an uptrend, downtrend, or sideways trend.
An uptrend means the price is generally going up. It’s like the roller coaster climbing a hill. A downtrend means the price is falling, like the roller coaster heading down a steep drop. A sideways trend means the price isn’t moving much in either direction, like the coaster moving on a flat track.
Patterns are like clues that help predict the next move. Some common patterns include the head and shoulders, double top, double bottom, and triangles. Imagine the roller coaster track forming shapes. These shapes give you hints about what might happen next.
Indicators and Oscillators:
Technical analysts also use tools called indicators and oscillators to help make predictions. Indicators are calculations based on the price and volume of an asset. They give you more information about the market’s strength or weakness.
One popular indicator is the Moving Average (MA). It smooths out price data to create a single flowing line. Think of it like drawing an average line through the roller coaster’s twists and turns to see the overall trend.
Another important indicator is the Relative Strength Index (RSI). It measures how fast prices are rising or falling. The RSI ranges from 0 to 100. If it’s above 70, the asset might be overbought (priced too high), and if it’s below 30, it might be oversold (priced too low). It’s like checking if the roller coaster is going too high or dropping too low too quickly.
Support and Resistance Levels:
Support and resistance levels are key concepts in technical analysis. Support is a price level where the asset tends to stop falling and bounce back up, like a roller coaster hitting a safety net. Resistance is a level where the price often stops rising and falls back down, like hitting the peak of a hill.
Imagine you’re on the roller coaster, and you notice it always slows down at certain points. These points are support and resistance levels. Traders use these levels to make decisions about buying or selling.
Conclusion:
Technical analysis is like being a detective in the world of investing. By studying charts, trends, patterns, indicators, and support and resistance levels, you can make educated guesses about where the prices of stocks or other assets might go next. Just like predicting the next twist and turn of a roller coaster, technical analysis helps investors navigate the ups and downs of the market.
So, if you ever find yourself wondering how to predict where a stock’s price is headed, remember that technical analysis is your trusty map. It might not always be right, but with practice and patience, it can help you make smarter investment decisions and enjoy the ride.
FAQS:
1. What is technical analysis in investing?
Technical analysis is a method used to predict the future price movements of financial assets like stocks or currencies by studying past price charts and trading volumes, rather than focusing on a company’s fundamentals or economic news.
2. What are the different types of charts used in technical analysis?
The most common types of charts in technical analysis are line charts, bar charts, and candlestick charts. Line charts show closing prices over time, bar charts provide more detail with opening, closing, high, and low prices, and candlestick charts show the same information with visual candles, which indicate whether the price went up or down.
3. What are trends and patterns in technical analysis?
Trends refer to the general direction of price movement, such as uptrends (prices rising), downtrends (prices falling), or sideways trends (prices remaining flat). Patterns, such as head and shoulders or double top, are shapes that appear on charts and can help predict future price movements.
4. How do indicators and oscillators help in technical analysis?
Indicators like Moving Averages (MA) and oscillators like the Relative Strength Index (RSI) provide additional insights into the market’s strength. The Moving Average smooths out price data to show overall trends, while the RSI measures the speed of price changes to signal overbought or oversold conditions.
5. What are support and resistance levels in technical analysis?
Support levels are price points where an asset tends to stop falling and bounces back up, while resistance levels are where the price often stops rising and falls. These levels help traders decide when to buy or sell assets based on price behavior at these key points.